- The NCAA Tournament selection committee uses a combination of predictive and results-based metrics to determine at-large bids and seeding.
- Predictive metrics such as NET, KenPom, BPI, and Torvik rankings focus on a team’s efficiency and strength of schedule.
- Results-based metrics like KPI, SOR, and Wins Above Bubble consider a team’s actual wins and losses.
- Teams like Gonzaga, Memphis, VCU, and Oregon present intriguing cases due to the variance in their predictive and results-based metrics used for March Madness.
There’s always going to be somebody unhappy with the March Madness selection process. It’s the nature of the beast with 364 Division-I men’s basketball programs playing only up to 31 regular-season games with just 68 NCAA Tournament berths available. Perceived snubs are inevitable and seeding that makes people shrug is almost as likely, no matter how many advanced metrics the NCAA employs to decipher between teams.
But the seven metrics listed this year on team sheets for the NCAA Tournament selection committee are more than ever before, with each ranking or rating separated into two distinct categories ‒ predictive metrics and results-based metrics. The NCAA Evaluation Tool (NET), KenPom, ESPN’s BPI and the Torvik rankings are considered predictive rankings that measure how good a team is based on its offensive and defensive efficiency, adjusted for opponent strength and location. The KPI, ESPN’s Strength of Record (SOR) and Wins Above Bubble (WAB) are results-based rankings that judge how hard it was for a team to attain its resume.
For many teams, the two types of ratings largely converge by the end of the season. For others, however, there can be a wide swath of outcomes based on how a game was played and whether it was won or lost. These are the schools from major and mid-major conferences that could inspire the most robust conversation and debate among committee members, either over their selection into the 2025 NCAA Tournament and/or their potential seeding in the field, due to the differences between their ranking in predictive metrics and results-based metrics.
Here’s a look at the most polarizing teams ahead of Selection Sunday based on the metrics used for the men’s NCAA Tournament:
IN DEPTH: Why the brains behind the NCAA bracket believe there’s a better way
IT’S BRACKET MADNESS: Enter USA TODAY’s Bracket Challenge contest for a chance at $1 million prize.
March Madness 2025: NCAA Tournament metrics’ most polarizing teams
All rankings as of Saturday, March 15
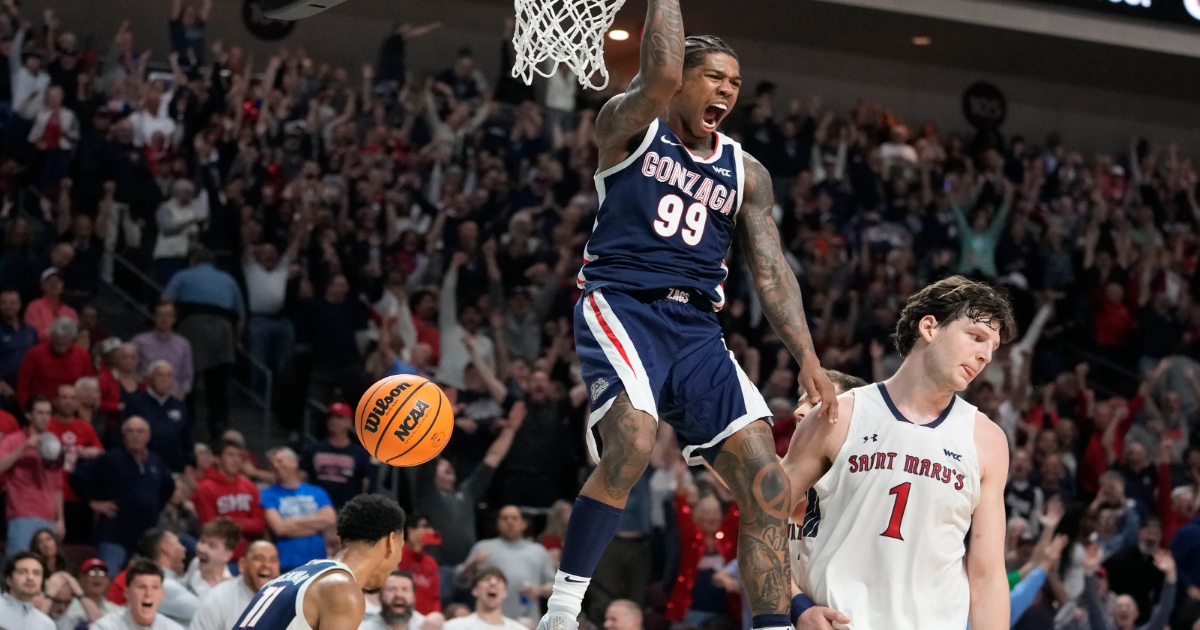
Gonzaga (25-8)
- NET: 8
- KenPom: 9
- BPI: 10
- Torvik: 11
- KPI: 28
- SOR: 39
- WAB: 35
The West Coast Conference tournament champions have predictive metrics on their side because they’re among the top 10 in offensive efficiency and top 30 in defensive efficiency this season, according to KenPom. Gonzaga’s win over Saint Mary’s Tuesday in the WCC was also its second quad one win this month. But the Bulldogs only have two other quad one wins the rest of the season.
Memphis (27-5)
- NET: 48
- KenPom: 51
- BPI: 43
- Torvik: 60
- KPI: 14
- SOR: 16
- WAB: 25
The Tigers will be hard for the selection committee to seed because their results-based metrics far outpace their predictive metrics thanks to an impressive run against one of the nation’s toughest nonconference schedules early in the season and a lot of closer-than-expected wins in the depleted American Athletic Conference.
VCU (26-6)
- NET: 31
- KenPom: 30
- BPI: 33
- Torvik: 28
- KPI: 38
- SOR: 48
- WAB: 54
VCU will be a fascinating test case for the selection committee if it doesn’t grab the Atlantic-10 Conference’s automatic berth. The Rams have lost just twice in 2025 and racked 11 double-digit wins that boosted their efficiency (and pushed their predictive metrics into the top-30). But VCU also has just one quad one win the entire season and didn’t schedule aggressively in nonconference play.
Oregon (24-9)
- NET: 29
- KenPom: 31
- BPI: 36
- Torvik: 38
- KPI: 10
- SOR: 20
- WAB: 13
Oregon is another team safely in the NCAA Tournament field, but its potential seeding varies because of the difference in its predictive and results-based metrics. Nonconference wins over Alabama and Texas A&M have aged well and the Ducks have countered a five-game losing skid with a seven-game winning streak entering the Big Ten tournament.
Ole Miss (22-11)
- NET: 28
- KenPom: 25
- BPI: 32
- Torvik: 29
- KPI: 18
- SOR: 22
- WAB: 12
The metrics for Ole Miss reflect the depth of the SEC, with its results-based rankings still inside the top-20 despite four losses in its last six games to close the regular season.
Wake Forest (21-11)
- NET: 68
- KenPom: 72
- BPI: 62
- Torvik: 71
- KPI: 59
- SOR: 44
- WAB: 51
Wake Forest is squarely on the bubble for this year’s NCAA Tournament field, largely because an inefficient offense is a drag on the Demon Deacons’ predictive metrics. Late-season losses to Florida State, North Carolina State and Virginia haven’t helped during another down year for the ACC.
Ohio State (17-15)
- NET: 41
- KenPom: 37
- BPI: 37
- Torvik: 41
- KPI: 53
- SOR: 57
- WAB: 55
Ohio State could wind up on the outside looking in of the NCAA Tournament because its shaky results-based metrics might overshadow efficiency numbers that are more line with a team in the field. The Buckeyes have played a lot of quad one games (17) but went 2-7 against the Big Ten’s best eight teams, according to the NET.
Drake (30-3)
- NET: 56
- KenPom: 58
- BPI: 73
- Torvik: 58
- KPI: 33
- SOR: 32
- WAB: 41
Drake saved the selection committee from a tricky conversation by winning the Missouri Valley Conference’s automatic berth. The Bulldogs’ predictive metrics varied, and they’re significantly lower than their results-based metrics. Nonconference wins over Vanderbilt and Kansas State, combined with a dominant run through league play, gives Drake a shot at a better seed than usual for the Missouri Valley champion.
UC San Diego (29-4)
- NET: 35
- KenPom: 39
- BPI: 58
- Torvik: 46
- KPI: 49
- SOR: 47
- WAB: 47
It’d likely make life easier on the selection committee if UC San Diego capped off its great regular season with the Big West Conference’s automatic berth because the Tritons could present a fascinating at-large profile. Their predictive metrics vary, with KenPom and the NET viewing them more favorably than Torvik and especially BPI. That’s unusual. Their results-based metrics aren’t as strong, but a nonconference win over Utah State and a 15-game win streak has UC San Diego potentially positioned for the school’s first NCAA Tournament berth in men’s basketball.